
How to use Value Stream Map to eliminate waste?
- Harshil Patel

- Oct 17, 2018
- 3 min read
Updated: Dec 10, 2018
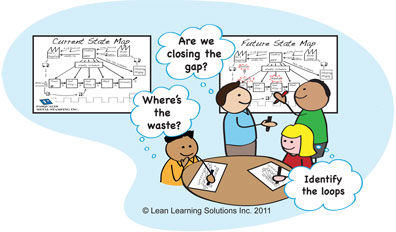
Value stream mapping is an important instrument used to distinguish waste in everyday operations. Value stream mapping is a lean-management strategy for breaking down the current state and planning a future state for the arrangement of occasions that take a product or service from its start through to the client with lessened lean wastes when contrasted with current map.
Type of waste
There are 7 types of waste in lean manufacturing
1. Transport
2. Inventory
3. Motion
4. Waiting
5. Over-Processing
6. Overproduction
7. Defects
Construct Value Stream Map
There are ten stage of value stream map
Stage 1: Collect Fundamental Information:
before proceeding with VSM, collect the following information:
A history of your mix of products from earlier deals.
The sales volume of each and every product produced during the prior year.
This information is useful in constructing a history of your product mix and the sales volume for each product helps you to apply the 80 - 20 rule of Pareto. In most cases, 20% of what most you build accounts for 80% of your business in a typical year.
Stage 2: Create a Product Quantity Routing Analysis
Start by listing both your consumers and products for each customer. Be sure to stick to to the basics regarding your products. Determine the volume for each product you made for your customers by referencing your sales from the previous year. Calculate the total number of products manufactured to show the volume of business generated by each customer in order to understand the basic demand for the previous year.
Stage 3: Group Customers and Sort Materials:
The purpose of this exercise is to identify which product families you want to map. Many PPMs do not know what their product families are, and if you try to map every product family at once in a HMLV environment, it will become too complicated.
Stage 4: Sort Product Families
When choosing the product or product family to map, consider the following:
Customer Return Rates
Greater Proportion of Units
Largest Dollar Volume
Defect Rates
Complex Products (use the most processes)
Stage 5: Construct Operation Flow Chart
Discuss and decide on the boundaries of your process: Where or when does the process start? Where or when does it end?
Discuss and decide on the level of detail to be included in the diagram.Brainstorm the activities that take place. Write each on a card or sticky note.
Arrange the activities in proper sequence.
When all activities are included and everyone agrees that the sequence is correct, draw arrows to show the flow of the process. Review the flowchart with others involved in the process (workers, supervisors, suppliers, customers) to see if they agree that the process is drawn accurately.
Stage 6: Walk the Process
At the point when it's an ideal opportunity to delineate product family, the group needs to go out for a walk around the shop floor.
Develop the VSM somewhere that the team has quick and easy access to the process. Optimally you will be at the process.
Stage 7: Characterize the essential Value Stream and fill in Data
Construct basic value stream map and start filling information
First add queue time between process and In most VSM’s, the focus is on the Process Cycle Time. Separate the cycle times between NVA time and VA time.
Enter all pertinent process data in boxes beneath each main process step box Examples of Process Data: Process Cycle Time, Changeover Time, Pace / TAKT Time / Rate

Comentarios